
Reports that turn data into decisions
Scheduled reports delivered to each site, on-demand reports whenever you need them, and benchmarks from our database that show where you stand against similar sites.
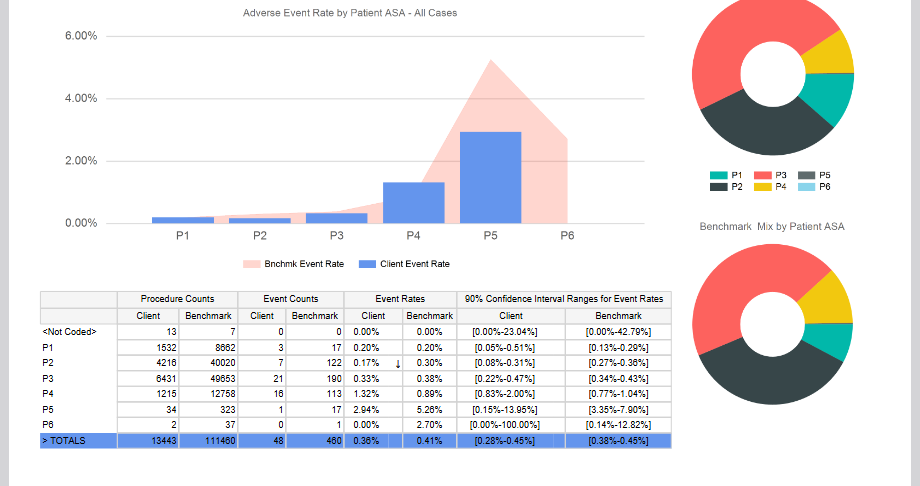
Outcomes by patient ASA class
Adverse event rates for each ASA physical status class, beside the benchmark for similar sites, with procedure and event counts and 90% confidence intervals, so you can see which differences are real.
One of a full set of outcomes views: trend, critical events, QA compliance, and outcomes by patient age, procedure duration, anesthesia type and provider.
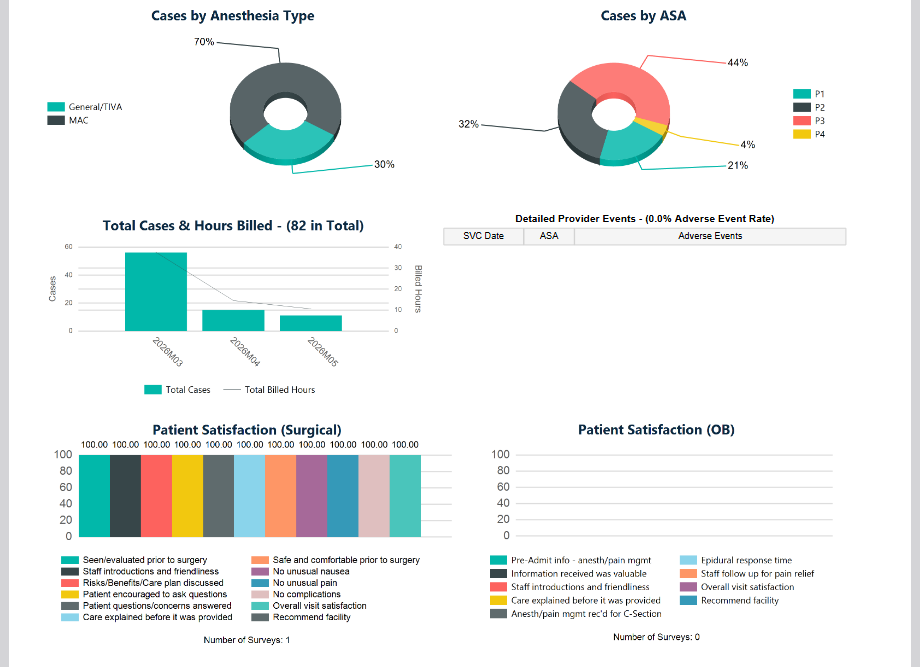
OPPE and FPPE
One provider's case mix by anesthesia type and ASA class, volume and billed hours, adverse events, and patient satisfaction, in a single report ready for your credentialing committee.
Shown for one provider, with the name removed.
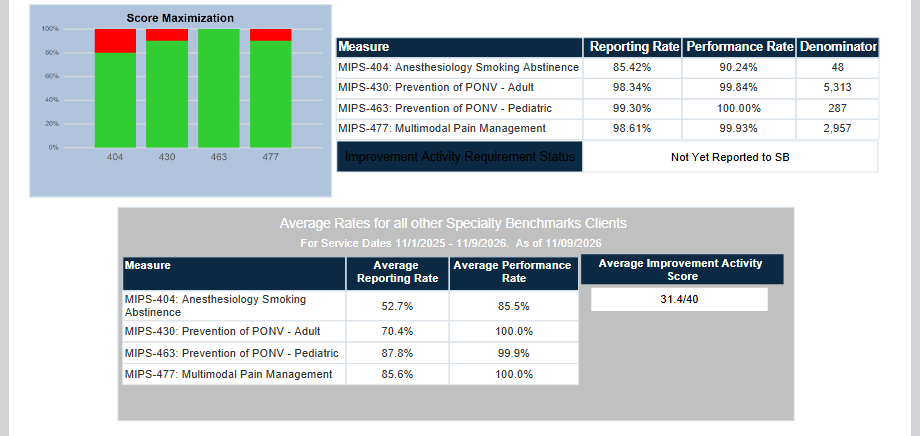
MIPS status
Reporting and performance rates for each measure, compared with the average across Specialty Benchmarks clients, so you can keep scores on track all year instead of finding gaps at submission time.
We submit to CMS for our full-service quality reporting clients.
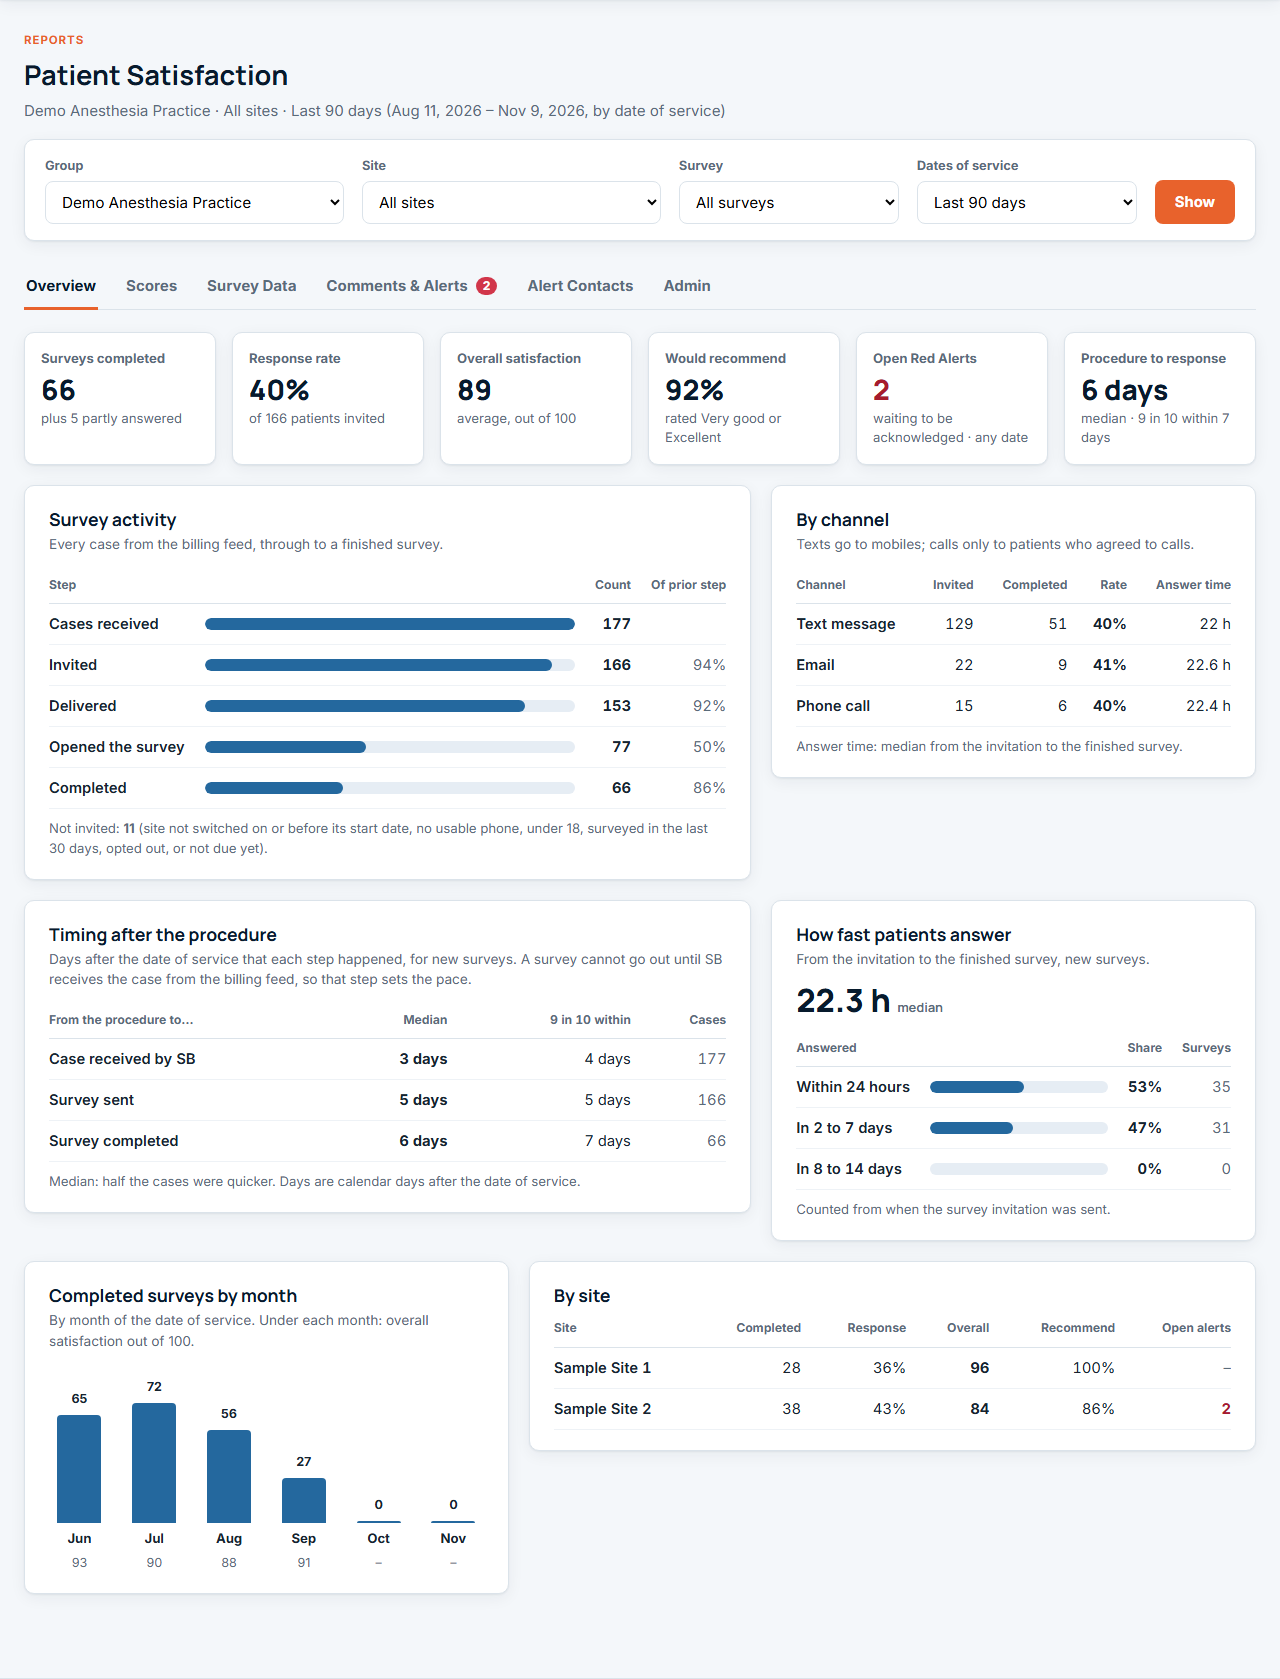
Patient survey dashboard
Response rates, scores by question, site and provider, patient comments and alerts, and the timing that MIPS Quality Measure 524 depends on.
Demo data. About the Patient Survey Service →
More reports
Every report runs for one site, a group of sites or your whole practice, over any date range.
Management reports
Outcomes across all your sites side by side, for hospitals and ASCs, with critical class events.
Detailed events
Every adverse event with its back-up detail, for peer review and quality committees.
QA compliance
Which sites and providers are completing their QA forms, so the data stays complete.
Provider statistics
Case volume, case mix and event rates by provider, as a report or a downloadable dataset.
MIPS review
Procedures still to code or not yet meeting a measure, with time to fix them before submission.
Practice dashboard
The headline numbers for your practice on one page, by site and date range.
Need a report you don't see here?
We build custom reports, data feeds and tools to fit your practice and your facilities. Tell us what you need, and we'll scope it and quote it.
Already a client?
Sign in to run any of these reports for your sites.